默认ELK时间轴: 以发送日志的时间为准 而Nginx上是以用户的访问时间记录的 架构说明: 192.168.189.83 Kibana Elasticsearch 192.168.189.84 Logstash、NginxLogstash 分析所有Nginx日志 vim /usr/local/logstash-6.6.0/config/logstash.conf input { file { path=>"/usr/local/nginx/logs/access.log" start_position => "beginning" sincedb_path => "/dev/null" } } filter { grok { match => { "message"=>'(?<clientIP>[0-9]{1,3}\.[0-9]{1,3}\.[0-9]{1,3}\.[0-9]{1,3}) - - \[(?<requesttime>[^ ]+ \+[0-9]+)\] "(?<requesttype>[A-Z]+) (?<requesturl>[^ ]+) HTTP/\d.\d" (?<status>[0-9]+) (?<bodysize>[0-9]+) "[^"]+" "(?<ua>[^"]+)"' } remove_field => ["message","@version","path"] } } output { if "_grokparsefailure" not in [tags] and "_dateparsefailure" not in [tags] { elasticsearch { hosts=>["http://192.168.189.83:9200"] } } } 保存退出。重启logstash
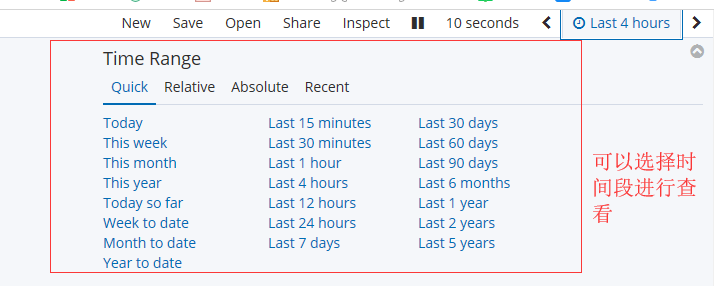
这时就会发现,时间轴时间错误得离谱。 我们可以用requesttime字段的值去覆盖@timestamp 的值 Logstash的filter 里面添加配置 09/Jun/2019:10:57:23 +0800 date { match => ["requesttime", "dd/MMM/yyyy:HH:mm:ss Z"] target => "@timestamp" } dd 日 MMM 月 yyyy 年 HH 小时 mm 分 ss 秒 Z 时区 +++++++++++++ 不同的时间格式,覆盖的时候格式要对应 20/Feb/2019:14:50:06 -> dd/MMM/yyyy:HH:mm:ss 2016-08-24 18:05:39,830 -> yyyy-MM-dd HH:mm:ss,SSS SSS 毫秒 +++++++++++++++++++++++++++++++++++ vim /usr/local/logstash-6.6.0/config/logstash.conf input { file { path=>"/usr/local/nginx/logs/access.log" start_position => "beginning" sincedb_path => "/dev/null" } } filter { grok { match => { "message"=>'(?<clientIP>[0-9]{1,3}\.[0-9]{1,3}\.[0-9]{1,3}\.[0-9]{1,3}) - - \[(?<requesttime>[^ ]+ \+[0-9]+)\] "(?<requesttype>[A-Z]+) (?<requesturl>[^ ]+) HTTP/\d.\d" (?<status>[0-9]+) (?<bodysize>[0-9]+) "[^"]+" "(?<ua>[^"]+)"' } remove_field => ["message","@version","path"] } date { match => ["requesttime", "dd/MMM/yyyy:HH:mm:ss Z"] target => "@timestamp" } } output { if "_grokparsefailure" not in [tags] and "_dateparsefailure" not in [tags] { elasticsearch { hosts=>["http://192.168.189.83:9200"] } } } 保存退出。 Kibana清空索引,保证日志最新。
重启logstash kill -9 logstash的进程 nohup /usr/local/logstash-6.6.0/bin/logstash -f /usr/local/logstash-6.6.0/config/logstash.conf >/tmp/logstash.log 2>&1 &

统计Nginx 日志:每分钟的访问量 cat /usr/local/nginx/logs/access.log |awk '{print $4}'|cut -b 1-19 |sort |uniq -c
logstash统计和Nginx的日志统计对比:
