架构: Filebeat -> Logstash -> Elasticsearch -> Kibana 部署服务介绍(filebeat可以装在其他Nginx服务器上) 192.168.189.83: Kibana、ES 192.168.189.84: Logstash、Filebeat、Nginx 本次实验:采集Nginx 日志 和 /var/log/secure 一、修改Filebeat配置文件: (192.168.189.84上操作) cd /usr/local/filebeat-6.6.0 && cp filebeat.yml filebeat.yml.20190611 vim filebeat.yml filebeat.inputs: - type: log tail_files: true backoff: "1s" paths: - /usr/local/nginx/logs/access.json.log fields: type: access fields_under_root: true - type: log tail_files: true backoff: "1s" paths: - /var/log/secure fields: type: secure fields_under_root: true output: logstash: hosts: ["192.168.189.84:5044"]保存,退出。重启filebeat pkill filebeat nohup /usr/local/filebeat-6.6.0/filebeat -e -c /usr/local/filebeat-6.6.0/filebeat.yml >/tmp/filebeat.log 2>&1 & 二、修改Logstash配置文件:(192.168.189.84上操作) cd /usr/local/logstash-6.6.0/config/ && cp logstash.conf logstash.conf.20190611 vim logstash.conf input { beats { host => '0.0.0.0' port => 5044 } } filter { if [type] == "access" { json { source => "message" remove_field => ["message","@version","path","beat","input","log","offset","prospector","source","tags"] } } } output{ if [type] == "access" { elasticsearch { hosts => ["http://192.168.189.83:9200"] index => "access-%{+YYYY.MM.dd}" } } else if [type] == "secure" { elasticsearch { hosts => ["http://192.168.189.83:9200"] index => "secure-%{+YYYY.MM.dd}" } } } 保存退出。重启logstash ps -ef | grep logstash kill -9 logstash进程ID nohup /usr/local/logstash-6.6.0/bin/logstash -f /usr/local/logstash-6.6.0/config/logstash.conf >/tmp/logstash.log 2>&1 & 三、在Kibana上清空原来的索引:保证使用最新的日志


四、触发日志 在其他电脑上访问192.168.189.84的Nginx ,重新开一个终端,ssh 登录192.168.189.84 Kibana上查看索引数据库:


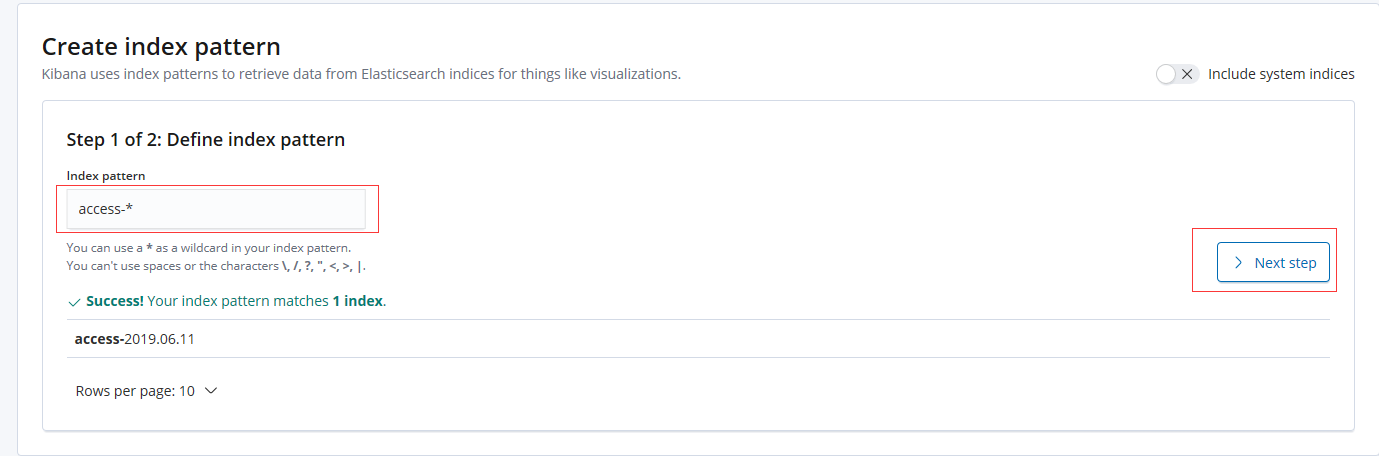
五、Kibana上建立索引,查看日志 1、access索引 2、secure索引