架构: Filebeat ----> Redis ----> Logstash(正则) -----> Elasticsearch(入库) -> Kibana展现 部署服务介绍 192.168.189.83: Kibana、ES 192.168.189.84: Logstash 192.168.189.73: Filebeat Nginx 192.168.189.92: Redis 一、Filebeat 收集的数据写入到Redis 修改filebeat 配置文件:(在189.73上操作) cd /usr/local/filebeat-6.6.0 && cp filebeat.yml filebeat.yml.20190611 Filebeat配置写入到Redis filebeat.inputs: - type: log tail_files: true backoff: "1s" paths: - /usr/local/nginx/logs/access.json.log fields: type: nginx fields_under_root: true output: redis: hosts: ["192.168.189.92"] port: 6379 password: 'shijiange' key: 'nginx'保存退出,重启filebeat pkill filebeat nohup /usr/local/filebeat-6.6.0/filebeat -e -c /usr/local/filebeat-6.6.0/filebeat.yml >/tmp/filebeat.log 2>&1 &二、触发日志,访问192.168.189.73 Nginx
查看 filebeat 日志:(在189.73上操作) tail -f /tmp/filebeat.log
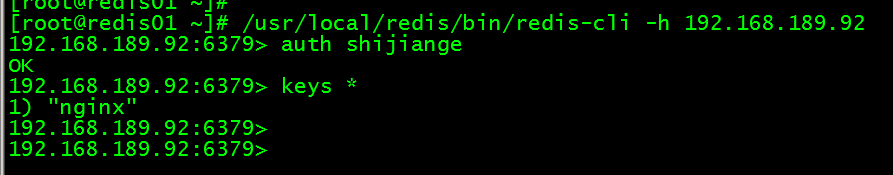
查询redis 中有无数据:(在189.92上操作)
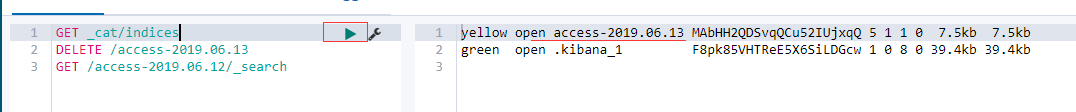
三、编辑Logstash配置文件 (在189.84上操作) cd /usr/local/logstash-6.6.0/config && cp logstash.conf logstash.conf201906111800 vim logstash.conf input { redis { host => '192.168.189.92' port => 6379 key => "nginx" data_type => "list" password => 'shijiange' } } filter { if [type] == "nginx" { json { source => "message" remove_field => ["message","@version","path","beat","input","log","offset","prospector","source","tags"] } } } output{ if [type] == "nginx" { if "127.0.0.1" not in [clientip] { elasticsearch { hosts => ["http://192.168.189.83:9200"] index => "access-%{+YYYY.MM.dd}" } } } else if [type] == "secure" { elasticsearch { hosts => ["http://192.168.189.83:9200"] index => "secure-%{+YYYY.MM.dd}" } } } 保存退出,重启logstash。kill -9 logstash的进程 nohup /usr/local/logstash-6.6.0/bin/logstash -f /usr/local/logstash-6.6.0/config/logstash.conf >/tmp/logstash.log 2>&1 & 四、在kibana上清空索引,保证使用最新的日志。


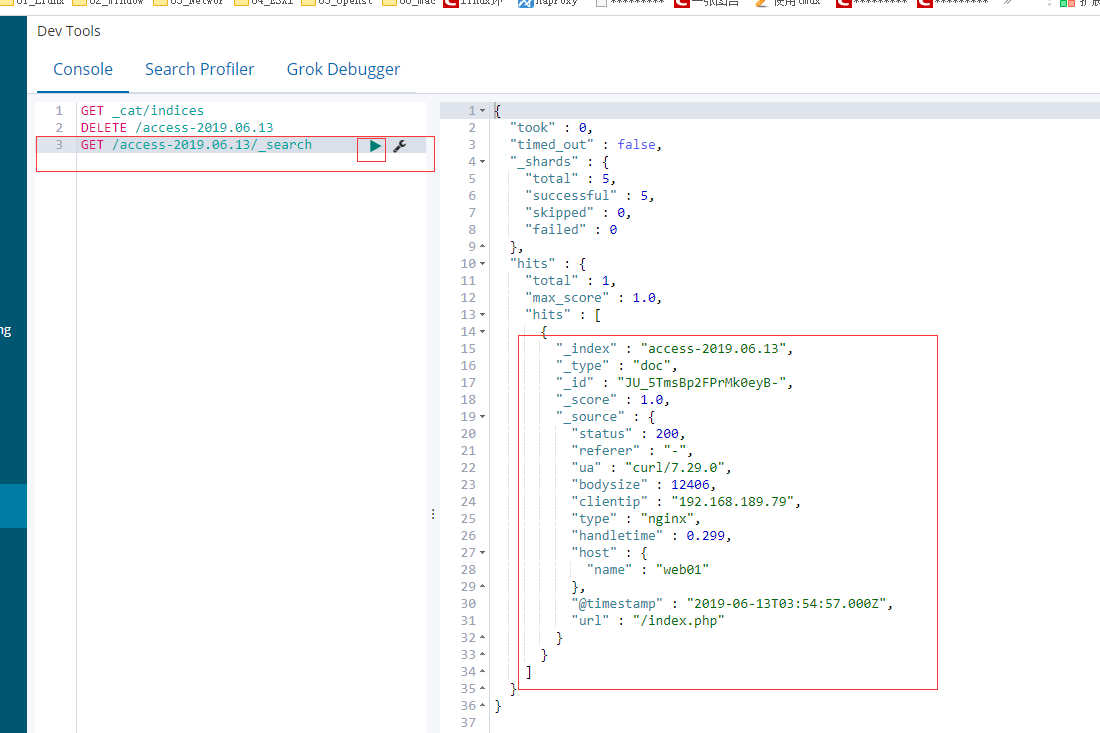
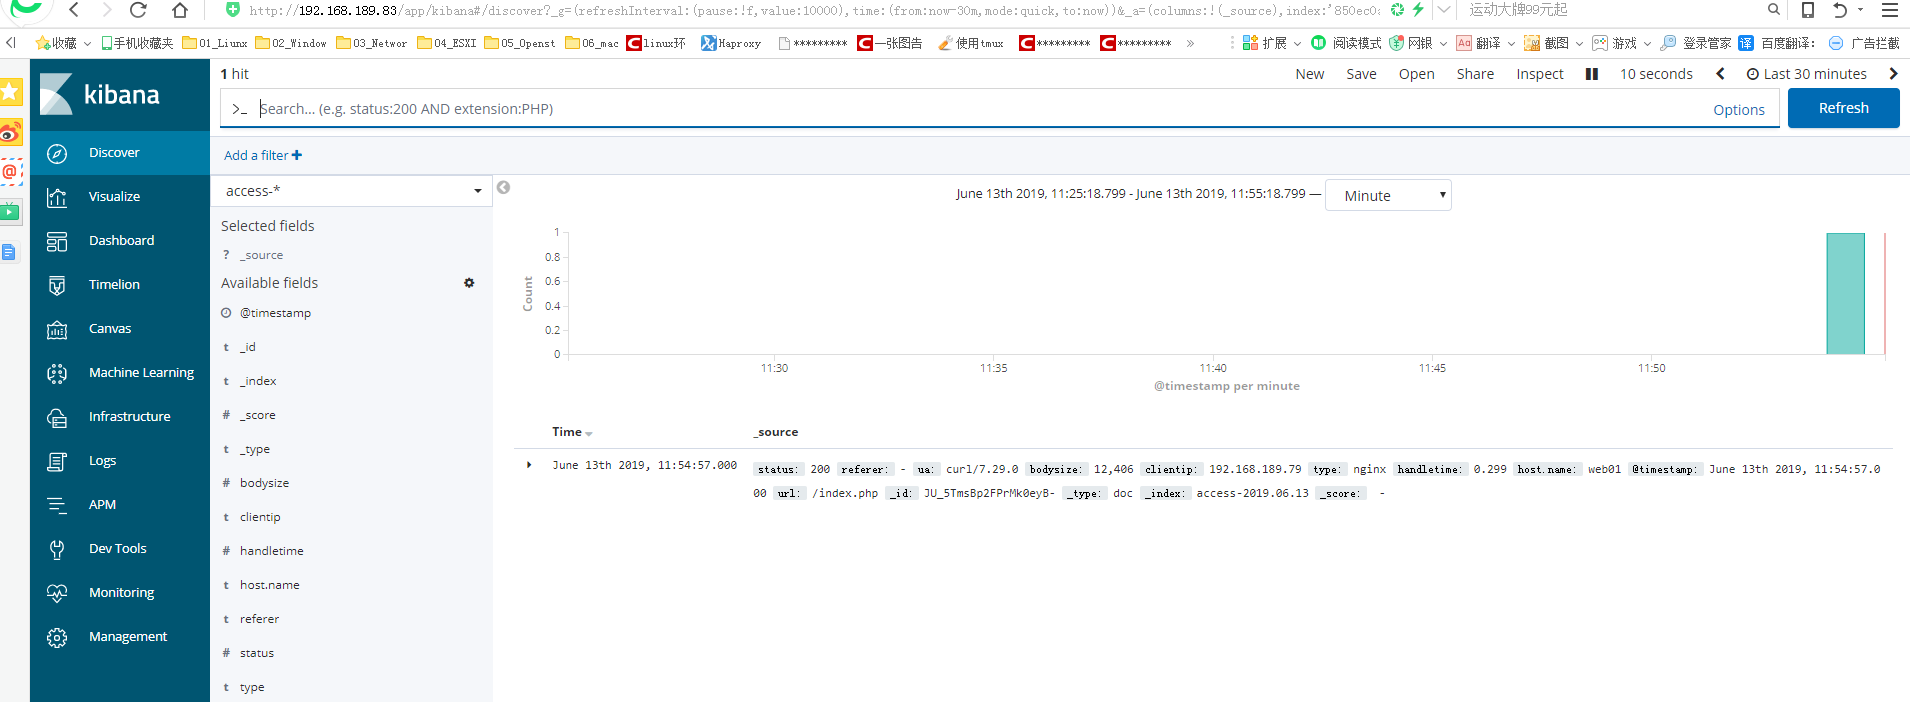
++++++++++ 再次访问192.168.189.73 ,触发日志,Kibana上查看数据