ELK架构:软件环境介绍: 操作系统:Centos7.4 最小化安装 Nginx 1.15.9 Discuz X3.4 Filebeat-6.6.0 logstash-6.6.0 kibana-6.6.0 elasticsearch-6.6.0 Redis5.05 Nginx Discuz 自行安装。Kibana Elasticsearch Logstash Redis 安装参考如下: Kibana: http://www.xchinagroup.top/?p=2777 Elasticsearch:http://www.xchinagroup.top/?p=2795 Logstash: http://www.xchinagroup.top/?p=2847 Redis: http://www.xchinagroup.top/?p=2977 一、web01、web02 都修改nginx 日志格式为json 修改nginx 日志格式为json格式 vim /usr/local/nginx/conf/nginx.conf 在http模块中添加如下内容: log_format json '{"@timestamp":"$time_iso8601",' '"clientip":"$remote_addr",' '"status":$status,' '"bodysize":$body_bytes_sent,' '"referer":"$http_referer",' '"ua":"$http_user_agent",' '"handletime":$request_time,' '"url":"$uri"}'; access_log logs/access.log; access_log logs/access.json.log json;
保存退出,重启nginx。 二、web01、web02 都安装 filebeat 6.6.0 Filebeat的安装: cd /opt wget https://artifacts.elastic.co/downloads/beats/filebeat/filebeat-6.6.0-linux-x86_64.tar.gz 下载速度很慢 wget http://www.xchinagroup.top/softdown/centos7/13_elk/filebeat-6.6.0-linux-x86_64.tar.gz 解压移到/usr/local下面,完成安装 。 tar zxf filebeat-6.6.0-linux-x86_64.tar.gz mv filebeat-6.6.0-linux-x86_64 /usr/local/filebeat-6.6.0 编辑filebeat配置文件: cd /usr/local/filebeat-6.6.0 cp filebeat.yml filebeat.yml.bak vim filebeat.yml web01的filebeat.yml 配置:
web02的filebeat.yml 配置:
保存退出,启动 filebeat 三、修改logstash配置文件 (189.84上操作) cd /usr/local/logstash-6.6.0/config && cp logstash.conf logstash.conf20190619 vim logstash.conf input { redis { host => "192.168.189.92" port => 6379 key => "webnginx" data_type => "list" password => 'shijiange' code => "json" } } filter { if [type] == "web01acc" or [type] == "web02acc" { json { source => "message" remove_field => ["message","@version","path","beat","input","log","offset","prospector","source","tags"] } } } output{ if [type] == "web01acc" { if "127.0.0.1" not in [clientip] { elasticsearch { hosts => ["http://192.168.189.83:9200"] index => "web01-%{+YYYY.MM.dd}" } } } if [type] == "web02acc" { if "127.0.0.1" not in [clientip] { elasticsearch { hosts => ["http://192.168.189.83:9200"] index => "web02-%{+YYYY.MM.dd}" } } } } 保存退出。 if "127.0.0.1" not in [clientip] :因为这两台上面的Nginx都有被zabbix监控,会有大量的127.0.0.1的请求,所以这里将其过滤掉。 检查配置文件是否有错:
重启logstash kill -9 logstash的进程 nohup /usr/local/logstash-6.6.0/bin/logstash -f /usr/local/logstash-6.6.0/config/logstash.conf >/tmp/logstash.log 2>&1 四、登录Kibana ,清空以前的数据,保证我们使用到的是最新的日志。


查询所有的索引
删除索引 delete /查找到的索引名称 ,点击右边的三角形 重新访问189.73 189.74 刷新日志,再次查询,看有无数据。

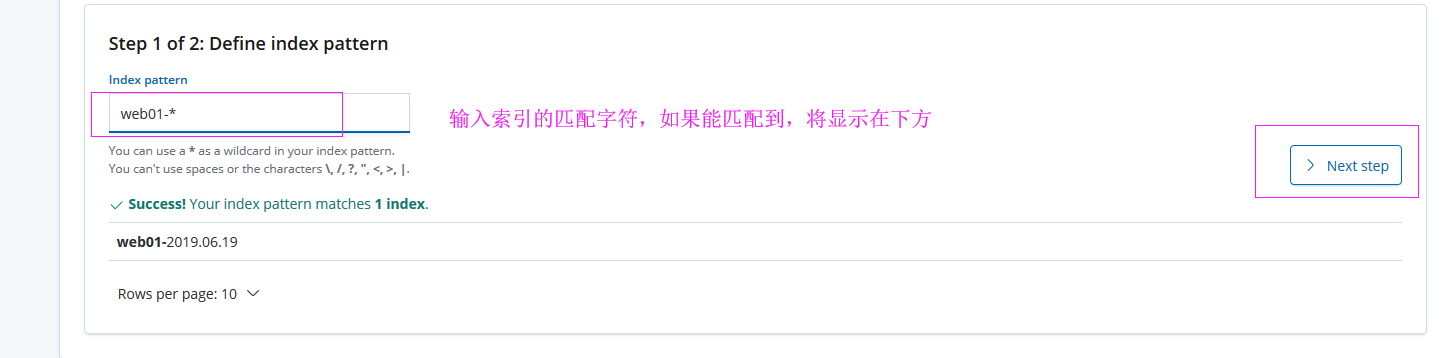
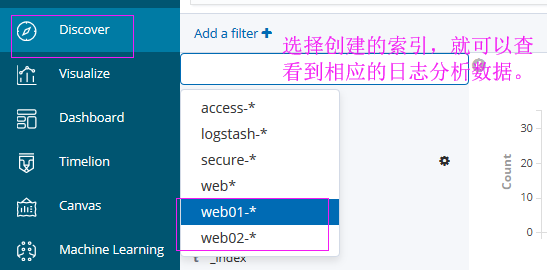
五、创建索引,用于查看索引的图形数据。

用同样的方法,创建web02的索引。
WEB01的日志分析数据: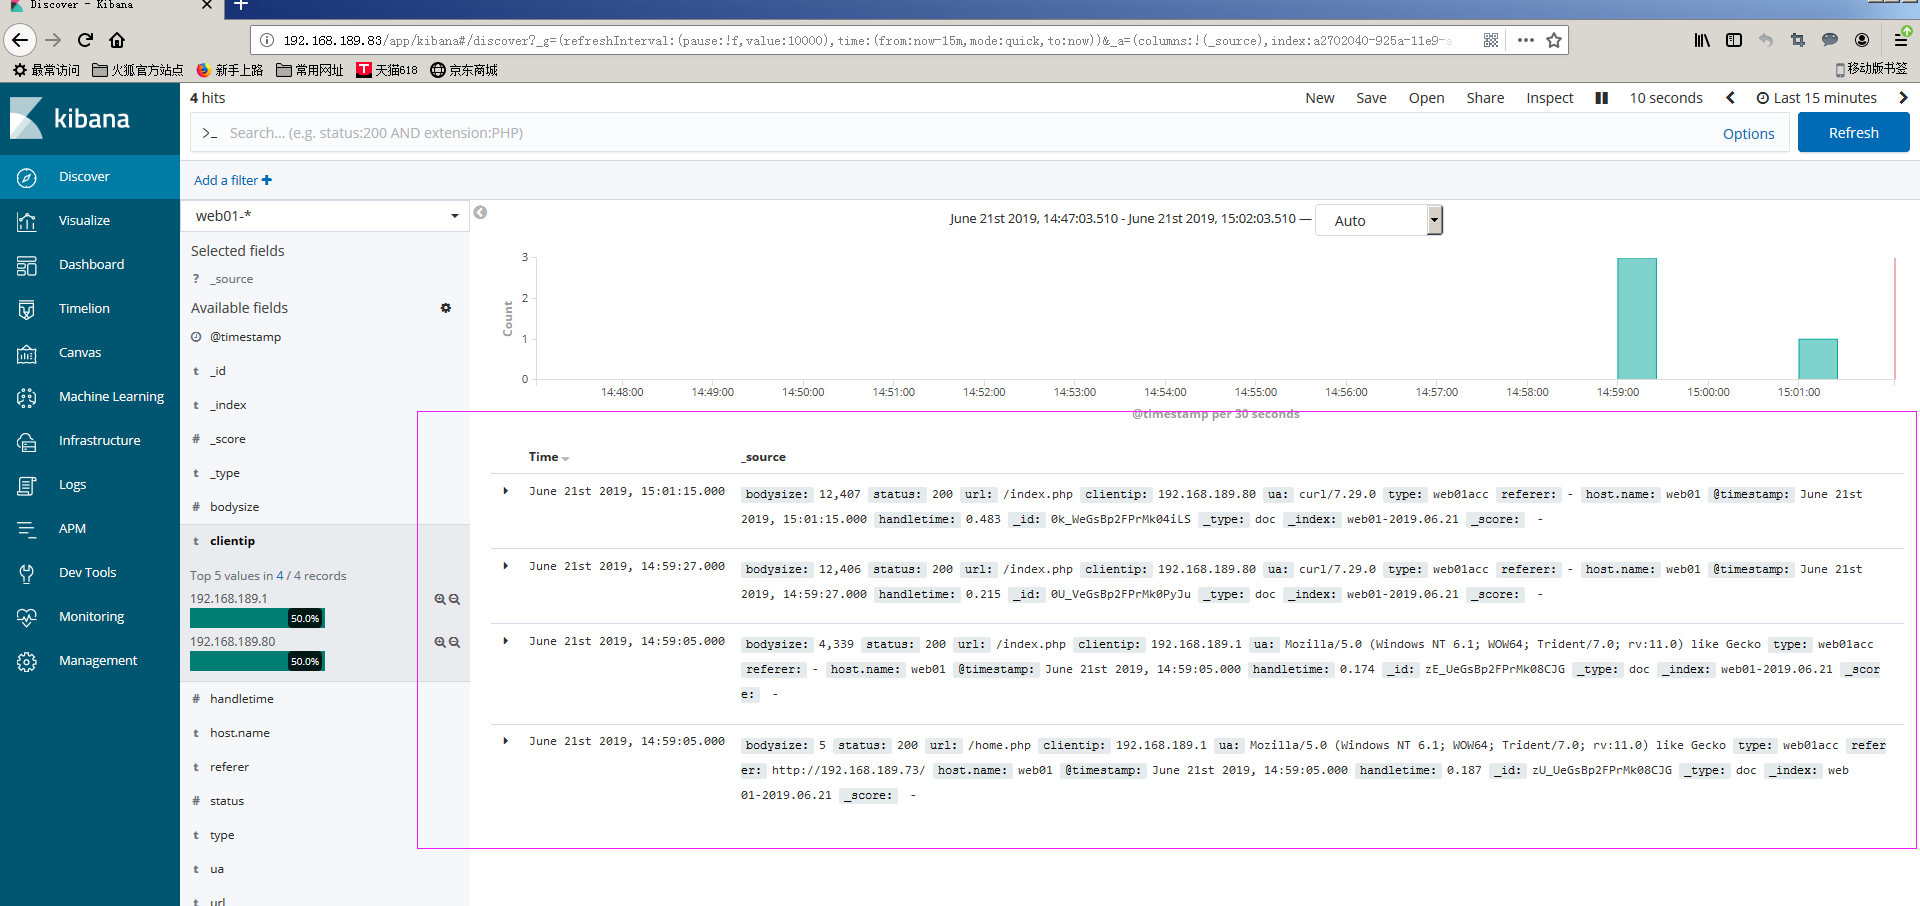
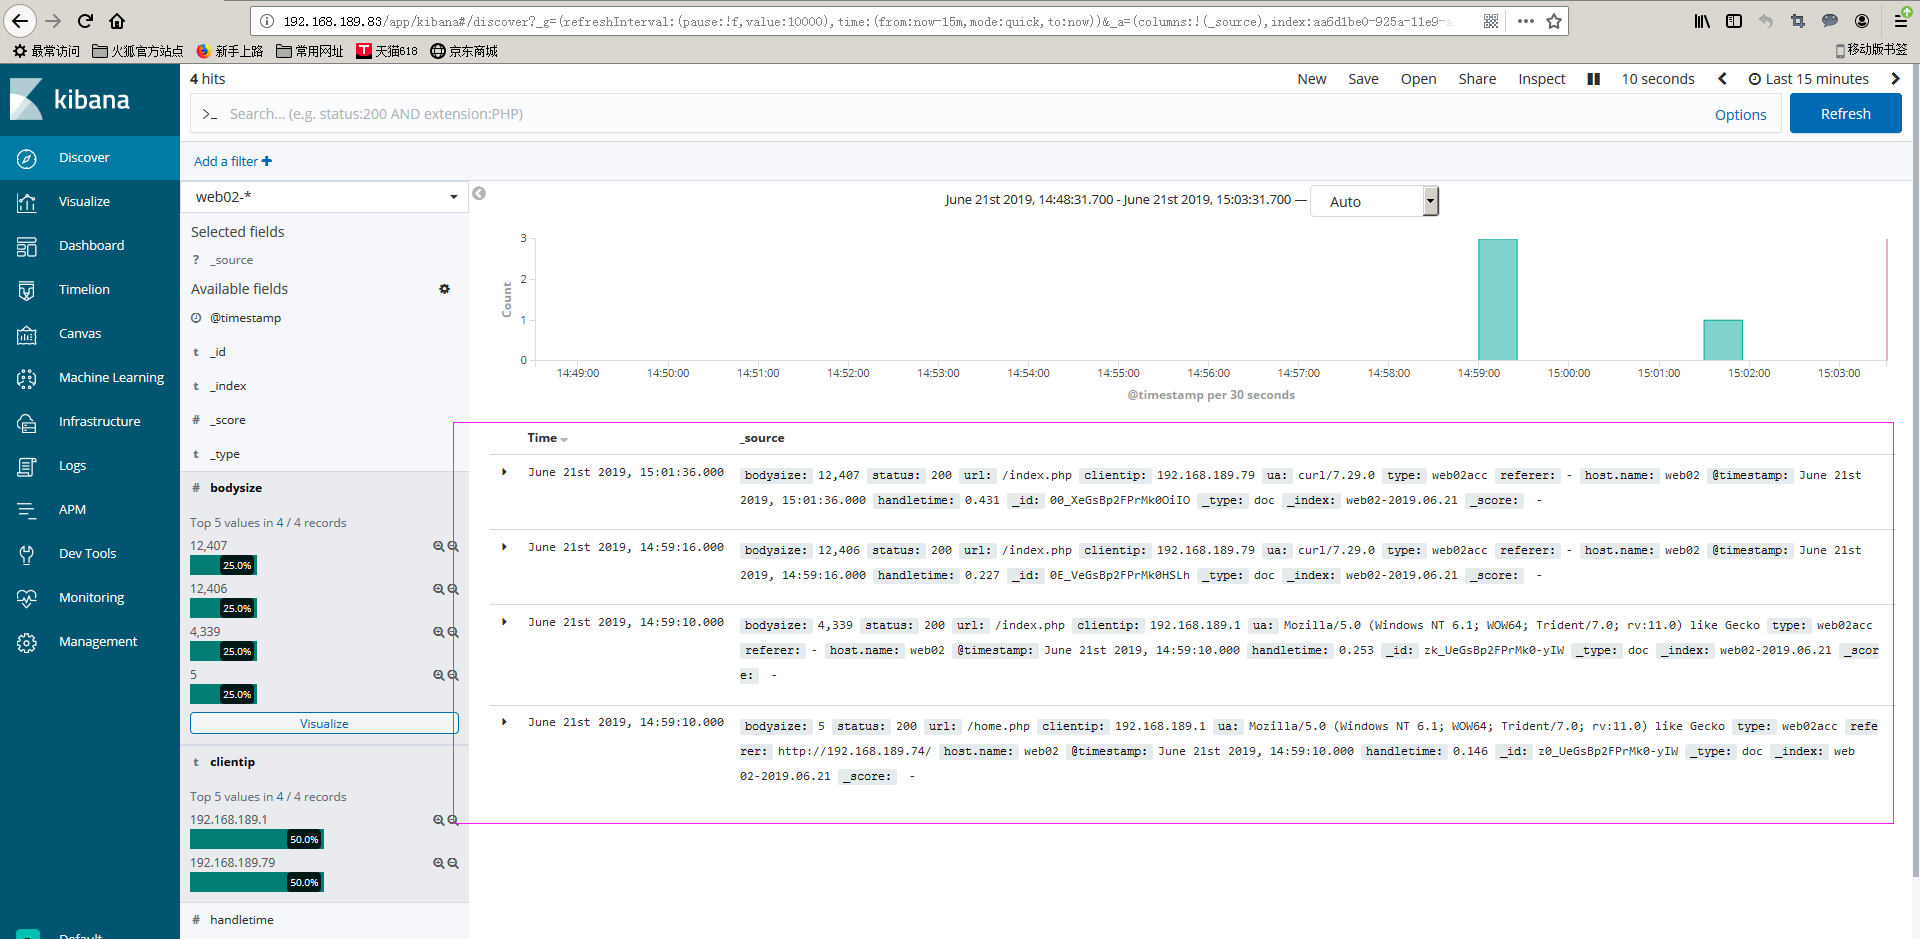
web02 的日志分析数据: