wmi_exporter(Windows) / node_exporter (Linux) 是用来做数据采集的 wmi_exporter 是属于 Martin Lindhe 开发的;node_exporter 是属于 Prometheus 开发的 下载安装 wmi_exporter 下载地址:https://github.com/martinlindhe/wmi_exporter/releases 双击安装后,exporter 自动运行,可以在服务列表里看到。 Windows 默认 9182 端口。 访问 http://127.0.0.1:9182/metrics 显示以下数据说明数据采集器安装成功。 #######++++++++++++#########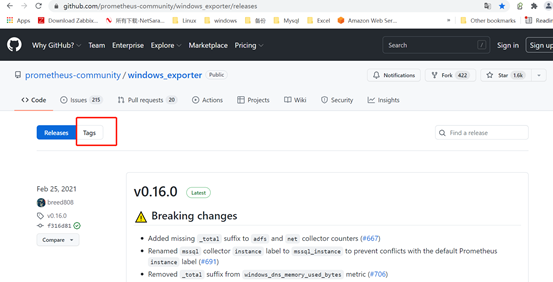
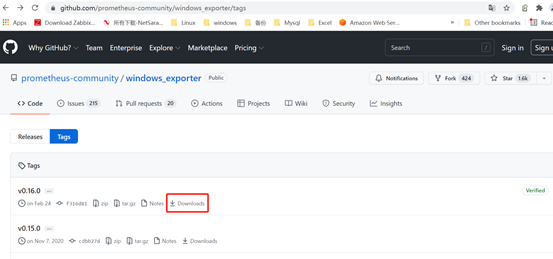
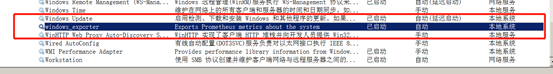
将下载好的windows_exporter-0.16.0-amd64.msi 上传到需要监控的windows 服务器,双击进行安装 windows 服务器关闭防火墙 安装完成后,可以在服务里面看到
2、登录Prometheus 服务器,修改配置文件 ,添加这台windows 服务器信息 cd /opt/prometheus vim prometheus.yml 在文件的最后面添加:
重启prometheus 服务 pkill prometheus /opt/prometheus/prometheus --config.file="/opt/prometheus/prometheus.yml" & 3、登录prometheus web界面,查看是否添加成功
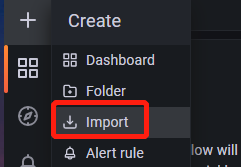
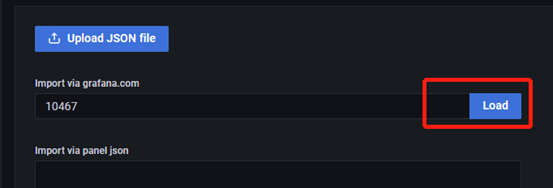
4、登录grafana 添加windows 监控模板,进行监控。 grafana8.3.1 使用的监控windows 的模板

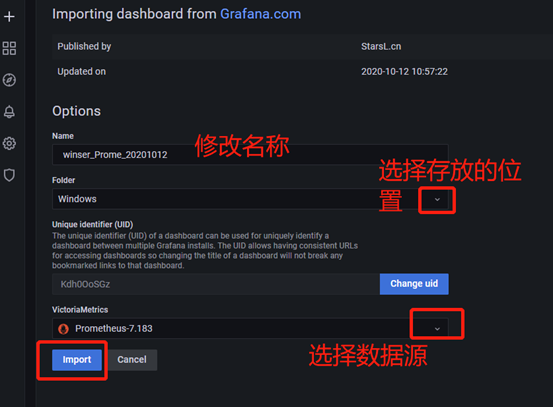
修改了模板中的内容,记得选择最上面的,保存。