实验环境: 106.12.88.74 ---> influxdb 1.7.6 Centos 7.5 106.12.88.228 ---> Grafana 6.2.2.1 Centos 7.5 119.3.92.176------> Telegraf 1.11.5-1 Nginx Centos 7.5 +++++++++++++++++++++++++++++++++ 119.3.92.176 安装 Telegraf 1.11.5-1 wget 'https://dl.influxdata.com/telegraf/releases/telegraf-1.11.5-1.x86_64.rpm' yum localinstall telegraf-1.11.5-1.x86_64.rpm -y 启动: systemctl start telegraf systemctl enable telegraf ++++++++++++++++++++++++++++ Telegraf 采集Nginx 数据 Nginx得支持 status的获取 Nginx在编译安装中,必须要加入 --with-http_stub_status_module 参数修改nginx 配置文件,添加IP,允许访问/status location = /status { allow 119.3.92.176; #一个网段 192.168.189.0/24 多个IP,写多个allow语句 deny all; stub_status on; access_log off; }
重启nginx 验证nginx 的状态信息:
nginx status详解 active connections –--- 活跃的连接数量 server accepts handled requests 总共处理了62个连接 , 成功创建62次握手, 总共处理了182个请求 reading — 读取客户端的连接数. writing — 响应数据到客户端的数量 waiting — 开启 keep-alive 的情况下,这个值等于 active – (reading+writing), 意思就是 Nginx 已经处理完正在等候下一次请求指令的驻留连接. 修改telegraf 配置文件: vim /etc/telegraf/telegraf.conf
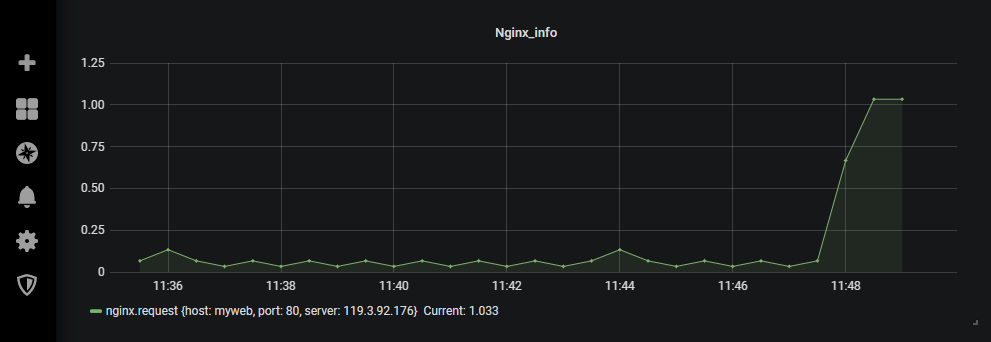
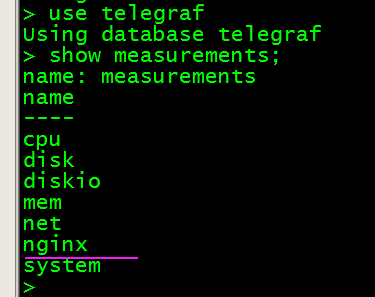
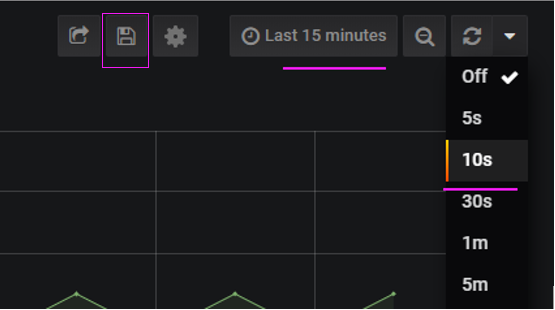
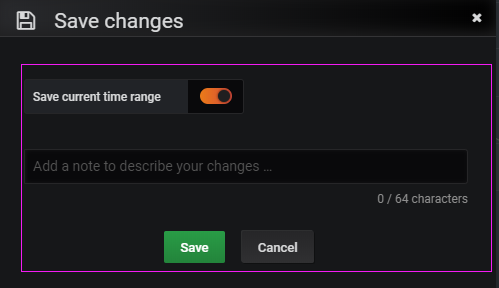
重启telegraf systemctl restart telegraf 106.12.88.228--->grafana 查看数据:
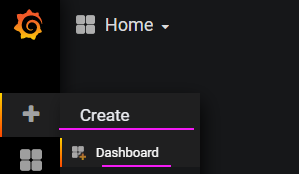
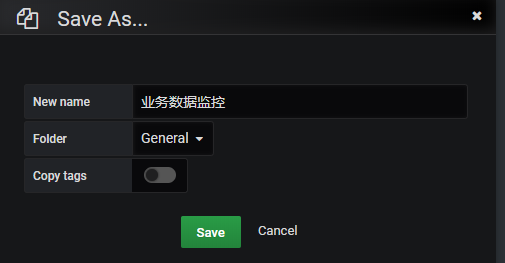
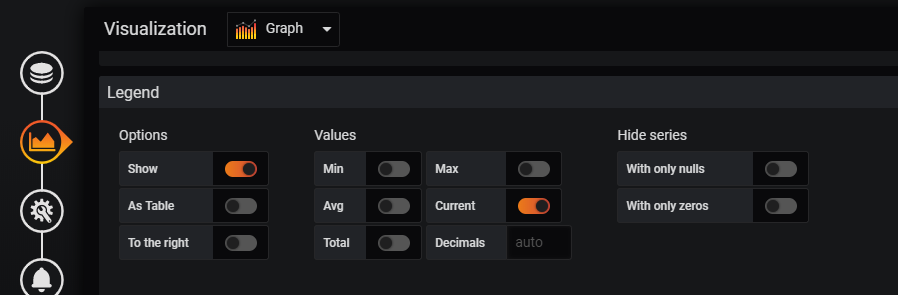
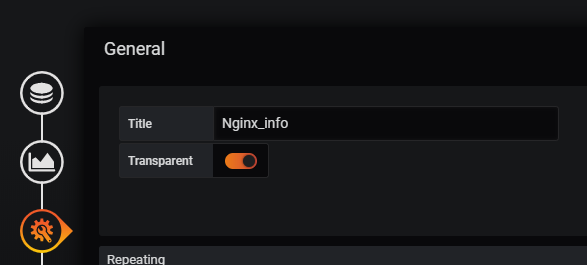
106.12.88.228 ---> Grafana 6.2.2.1 配置 重新创建一个 业务数据监控 面板

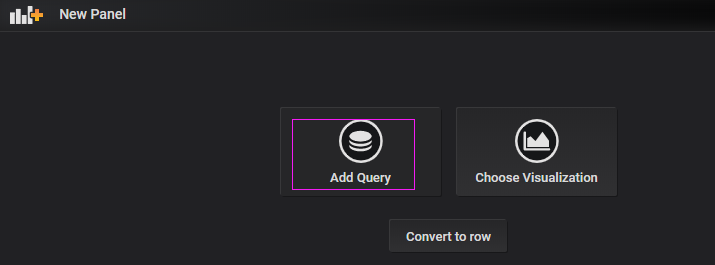
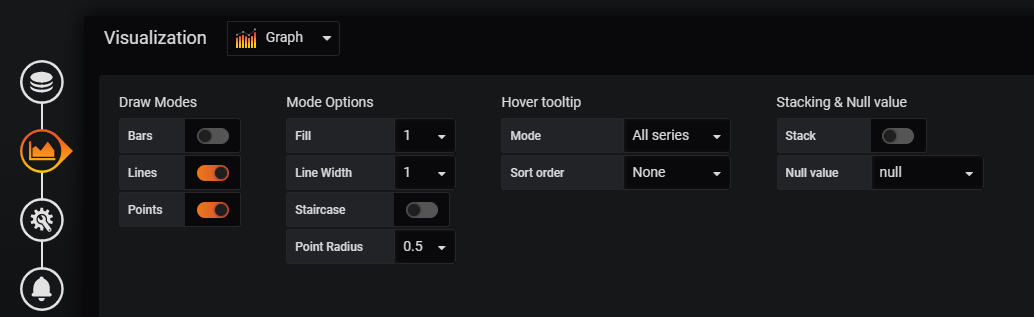
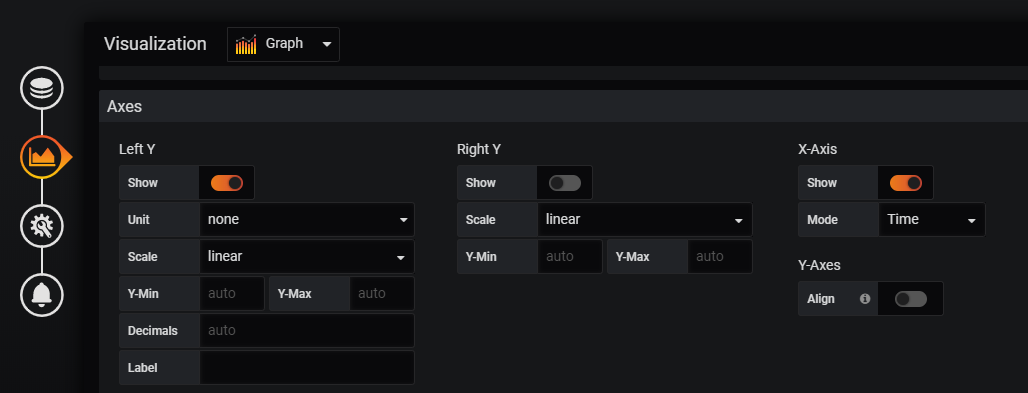
可以在上图中添加多个监控项,根据自己环境添加。
在119.3.92.176 上面,运行一个脚本,模拟数据访问。