实验环境: 106.12.88.74 ---> influxdb 1.7.6 Centos 7.5 106.12.88.228 ---> Grafana 6.2.2.1 Centos 7.5 119.3.92.176------> Telegraf 1.11.5-1 PHP 7.1.17 Centos 7.5 +++++++++++++++++++++++++++++++++ 119.3.92.176 安装 Telegraf 1.11.5-1 wget 'https://dl.influxdata.com/telegraf/releases/telegraf-1.11.5-1.x86_64.rpm' yum localinstall telegraf-1.11.5-1.x86_64.rpm -y 启动: systemctl start telegraf systemctl enable telegraf ++++++++++++++++++++++++++++ Telegraf 采集php-fpm 数据 修改php-fpm 配置文件, vim /usr/local/php7/etc/php-fpm.d/www.conf保存,退出。重启php-fpm systemctl restart php-fpm 修改nginx 配置文件: vim /usr/local/nginx/conf/nginx.conf 在server 模块添加如下: location ~ ^/(phpstatus)$ { include fastcgi_params; fastcgi_pass 127.0.0.1:9000; fastcgi_param SCRIPT_FILENAME $fastcgi_script_name; }
重启nginx 验证,php status
php status详解 pool – fpm池子名称,大多数为www process manager – 进程管理方式,值:static, dynamic or ondemand. dynamic start time – 启动日期,如果reload了php-fpm,时间会更新 start since – 运行时长 accepted conn – 当前池子接受的请求数 listen queue – 请求等待队列,如果这个值不为0,那么要增加FPM的进程数量 max listen queue – 请求等待队列最高的数量 listen queue len – socket等待队列长度 idle processes – 空闲进程数量 active processes – 活跃进程数量 total processes – 总进程数量 max active processes – 最大的活跃进程数量(FPM启动开始算) max children reached – 大道进程最大数量限制的次数,如果这个值不为0,说明你的最大进程数量太小了,请改大一点。 slow requests – 启用了php-fpm slow-log,缓慢请求的数量 修改telegraf 配置文件: vim /etc/telegraf/telegraf.conf
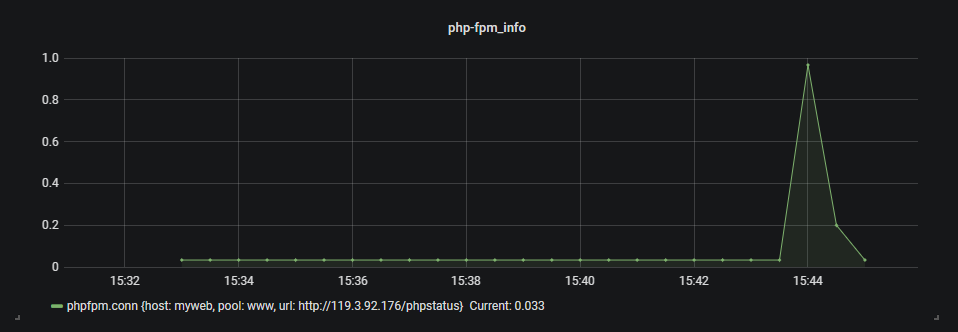
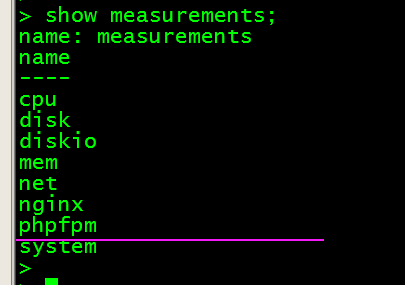
重启telegraf systemctl restart telegraf 106.12.88.228--->grafana 查看数据:
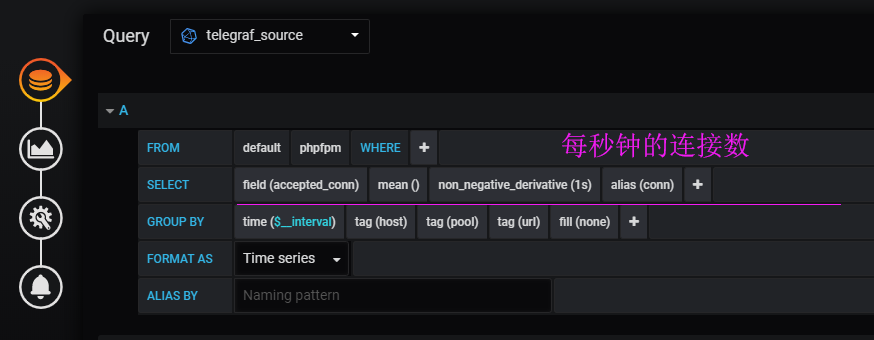
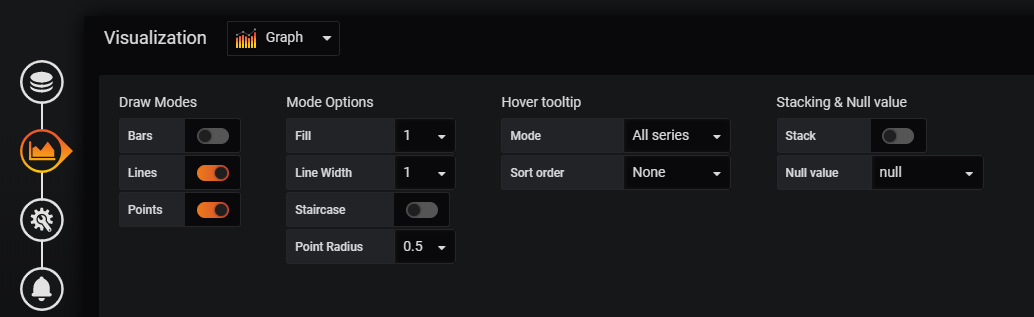
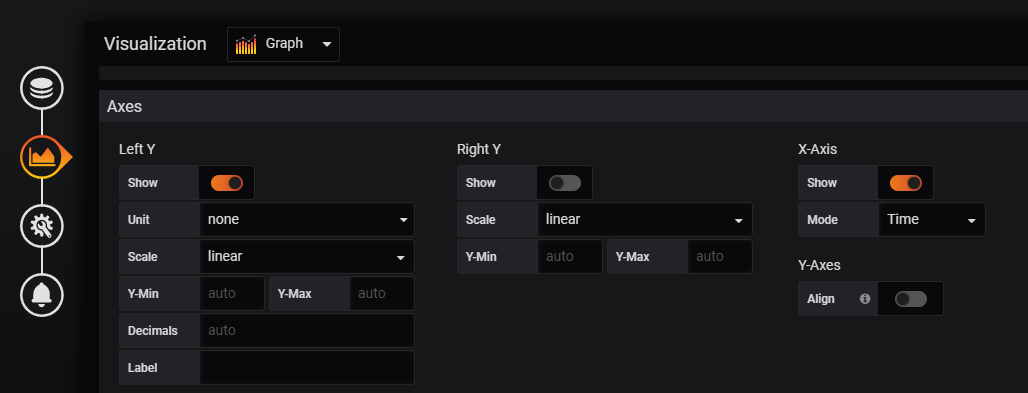
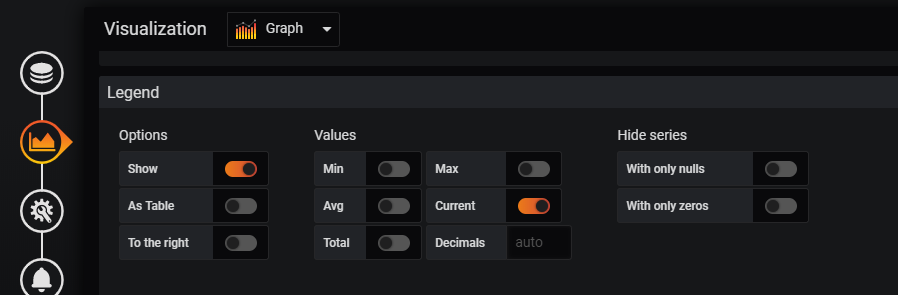
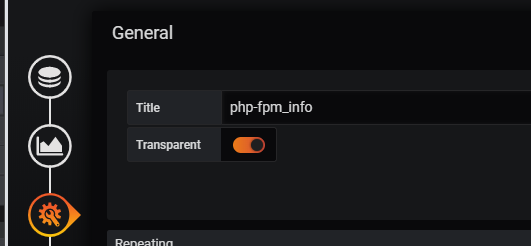
106.12.88.228 ---> Grafana 6.2.2.1 配置 复制先前创建的 nginx 监控 ,进行修改


在119.3.92.176(PHP) 上面,运行一个脚本,模拟数据访问。